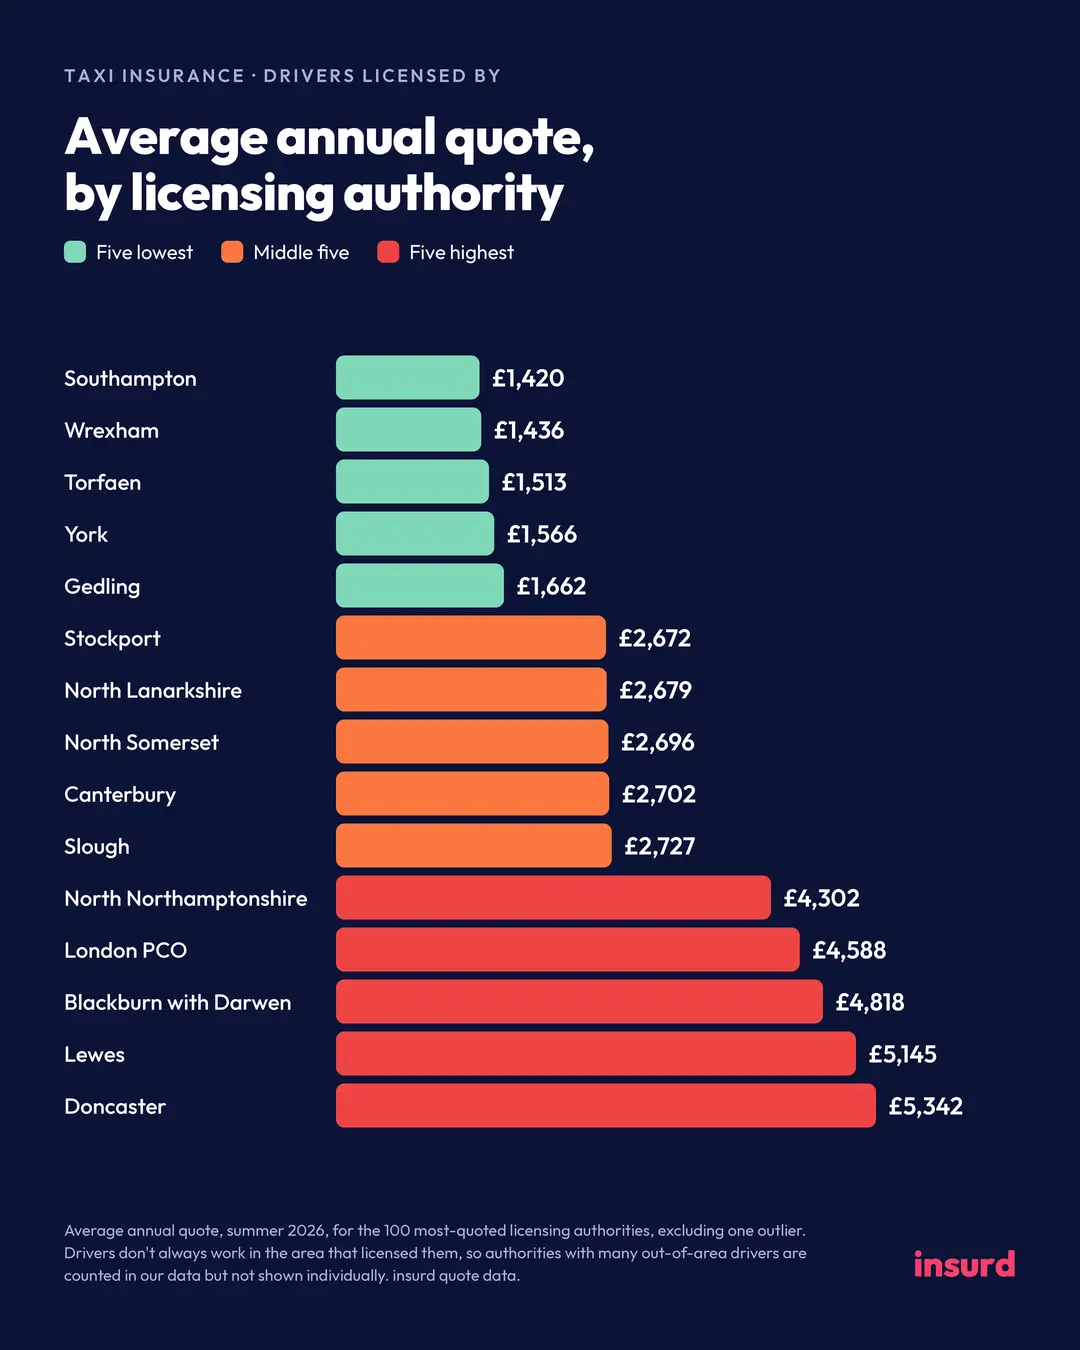
Some crazy figures published by insurance broker, er, Insurd.
(Although they stylise it without the captial I (thus insurd) I've capitalised it, because in text it looks a bit odd and like some sort of error. And not so easy to tell it's a proper noun and business name rather than a verb, or whatever

)
Anyway, there's a slew of figures available via the link below, and zillions of caveats etc.
But in headline terms, the cheapest area in the UK to insure a 'taxi' is Southampton at an average of £1,420, while the dearest is Doncaster at £5,342

And note these are
averages per each licensing area. Thus impossible to tell how high they go in the likes of Doncaster, but if the
average is £5.3k then the mind boggles

This is the main summary graphic here, but other graphics via the link below:
https://insurd.co.uk/wp-content/uploads ... -2026.webpAnd there's no obvious rationale that I can see - I mean, Brighton is quite low at £1,910, while Lewes next door is among the highest at £5,145.
So it's not obviously an urban/small town or rural thing. But I'm not sure

There's figures for the 100 biggest authorities, which is in terms of licences issued. To that extent, the more rural areas wouldn't be included. I think.
And, slightly oddly, can't see any mention at all of public/private hire - it's just 'taxi' insurance. There's also mention of the cross-border aspect. Which might explain the likes of Lewes and the high premiums there - I'd guess the likes of Wolves will attract a lot of less experienced drivers, for example, and to that extent they'll be quoted higher amounts, even ignoring the cross-border working angle.
That said, the figure for Wolves is quite high, but by no means off the scale compared to others.
(And another caveat is that an outlier with an unusually high average is excluded - wonder where that could be?

Wondered where I'd seen the word 'outlier' (or if I'd imagined it) because couldn't find it in the text of the page, which just says the area had an 'unusually high average'. Then realised it was in the graphic above
)
And note also that the figures all seem to be quotes, as opposed to policies acutally taken out. Not sure how significant that might be in the grand scheme of the figures...
Anyway, could witter on about these figures for ages, but life's too short, and maybe better if folks just look at the information on the source page:
https://insurd.co.uk/taxi-insurance/cos ... authority/
 Login
 Register
 FAQ