Incidentally, the numbers are a bit confusing, but it's easier to use the decimal system (1.0, 0.5, 0.1 etc) rather than the other (20/50, 6/12 etc) method.
But they're just fractions expressed in a different way. So 6/12 is the same as 20/40, which as a fraction is obviously 1/2, which is 0.5 as a decimal.
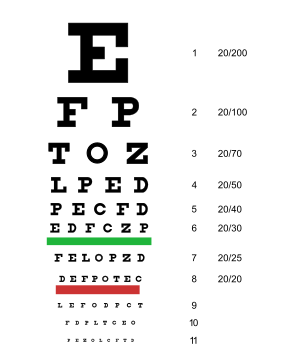
So 20/20 vision is simply 1.0, and as the number gets smaller your acuity gets worse - 0.6 isn't bad, while with 0.1 you can just read the top letter of the chart. 0.05 and you couldn't read any letters on the chart, while 1.2 is slightly better than 20/20.
So for a standard driving licence you only need 0.5 in either eye, which is roughly half way down the eye chart (in the chart above that's the 20/40 line).
For Group 2 you need 0.8 in the better eye, which will be towards the bottom of the eye chart. The bad eye must be at least 0.1, which is the big letter at the top of the chart

(In the particular chart above 0.1 is 20/200, while 0.8 is 20/25)
However, 0.8 in one eye and 0.1 in other is quite a difference, and I suspect most people's will be closer together. Both 0.7, say, or one is 1.0, while the other 0.8.
Of course, there are different eye charts, but for an ordinary driving licence (0.5) you should be able to read about half way down the chart. For Group 2, the worse eye (0.1) needs to be able to read what would normally be the top letter of the chart. For the better eye (0.8 ) you would need to read to towards the bottom of the chart, but how far down will depend on the individual chart. Most will probably also have rows of letters at 1.0 and 1.2 or whatever, which obviously exceeds the Group 2 standard.
However, if you're getting a proper eye test done at an optometrist then I don't think they use simple charts like the one above anymore, but you'll be asked to read letters of some kind, and the basic principle is the same.
But I suspect GPs and those doing taxi medicals might use the old-fashioned wall chart like the one above.


 )
)


